:format(webp))
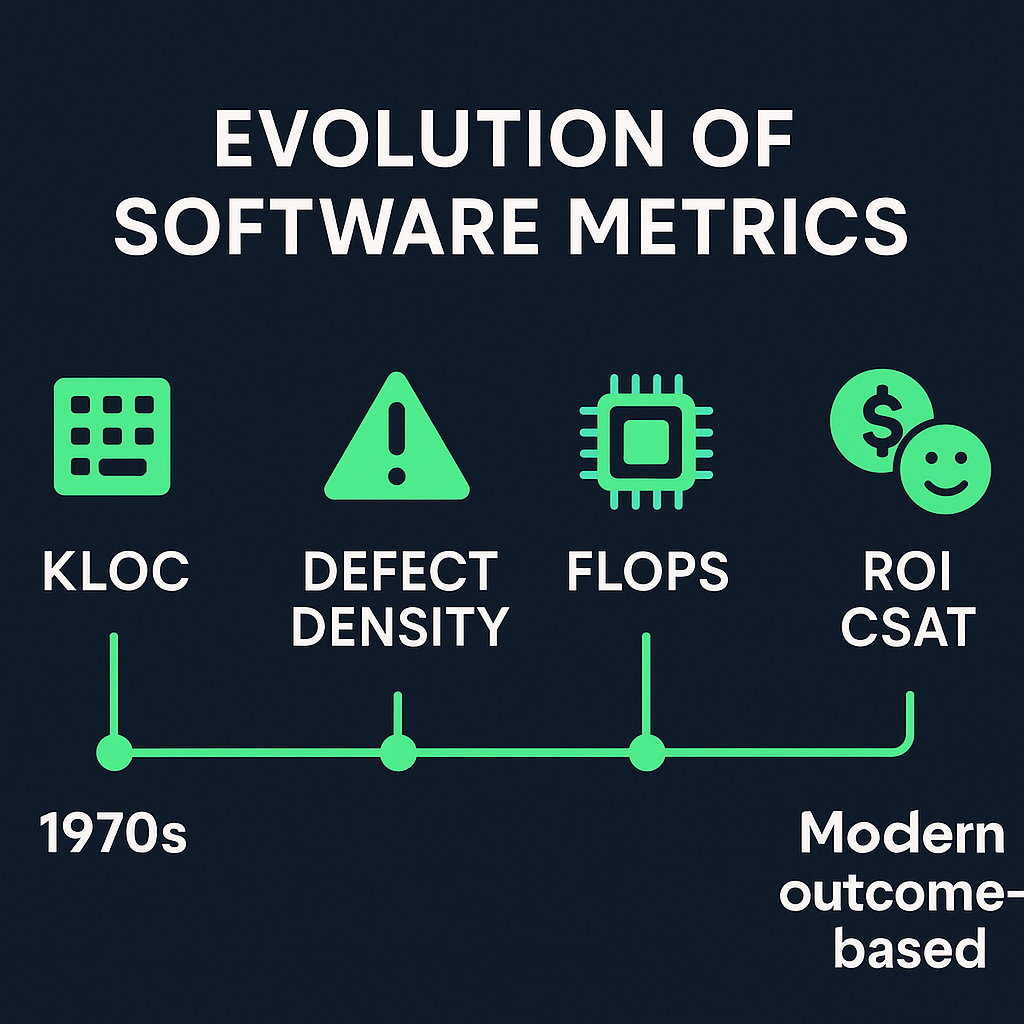
From Lines of Code to Outcomes: A Journey in Software Metrics
By the time you finish this article, you’ll understand how software measurement has shifted from counting code to quantifying real value—and you’ll discover some lesser-known metrics that bring fresh insight to your projects.
How We Got Here: Early Software Metrics
Back in the 1970s, IBM and other large shops used KLOC (thousands of lines of code) to gauge progress. A rule-of-thumb estimated a programmer produced roughly 20 lines of functional code per day, so a single KLOC represented about 50 workdays of effort.
Defect Density: Quality by the Numbers
Measuring errors per KLOC—known as defect density—emerged as a critical quality indicator. In safety-critical domains, it still matters: the Space Shuttle flight software (around 400 KLOC) achieved fewer than one defect per thousand lines after exhaustive validation.
Software | Size (KLOC) | Defects per KLOC |
|---|---|---|
Space Shuttle Flight Software | 400 | <1 |
Industry Average Software | 1,000 | ~5 |
Whimsical Measures: When Lines Aren’t Enough
Programmers sometimes joked in terms of “WaP” (War and Peace)—71,500 lines of code—to illustrate how arbitrary code-size analogies could be. It underscored that LOC alone tells only part of the story.

Why Code Size Alone Falls Short
Counting every line doesn’t account for language expressiveness. High-level languages yield more functionality per line than assembly, so teams introduced assembly equivalent lines with conversion factors to level the field.
Beyond Software: Measuring Hardware Speed
As computing advanced, hardware metrics took center stage. FLOPS (floating-point operations per second) became standard for scientific workloads, while BogoMIPS offered a tongue-in-cheek estimate of CPU idle-loop speed.
Shifting Focus to Outcomes
Measuring raw output no longer satisfies modern teams. Today, success hinges on business impact:
Delivering features that drive revenue
Improving customer retention
Reducing time to market
Agile methodologies champion short iterations, constant feedback and alignment with stakeholder goals. This ensures each increment furthers real outcomes instead of just adding code.
Key Business-Centered Software Metrics
To link engineering efforts to business goals, consider these metrics:
Measures financial return relative to development cost.
Surveys or Net Promoter Score gauge how happy users are.
Tracks feature adoption, session length and active users.
Defect Density
Continues to highlight quality, especially in regulated environments.
Time from code commit to production deployment.
Duration of a development iteration or flow step.
Number of work items completed in a period.
%C&A (Percent Complete & Accurate)
Measures how well requirements are met without rework.
Value Stream Metrics Explained
Focusing on flow rather than fate, value stream metrics pinpoint bottlenecks and help teams shave days—sometimes weeks—off delivery cycles.
Measuring Project Success Holistically
Beyond software-only measures, project leaders track a broader set of KPIs. According to PMI’s project performance indicators , these include:
Schedule Variance: Are tasks finishing on time?
Cost Variance: Does spending match budgets?
Scope Stability: How often do requirements shift?
Quality Metrics: Defect rates in testing and production.
Business Impact: Revenue growth, cost savings or market share gains.
These KPIs ensure you don’t overlook hidden debts in time, money or customer goodwill.
Blending Flow and Outcome for Agility
Your teams hit top speed when you unite value stream data with outcome metrics. For example:
Use cycle time to identify slow stages
Track feature usage to prioritize the backlog
Tie customer satisfaction to sprint goals
This mix keeps everyone rowing toward the same destination: measurable value.
Your Next Milestone
Software measurement has come a long way from counting lines. By combining flow-based metrics (lead time, throughput) with outcome-based indicators (ROI, CSAT), you gain a clear, balanced view of both efficiency and effectiveness. Apply these approaches, and you’ll see not just more code, but more value.
:format(webp))
:format(webp))
:format(webp))